Local SEO and web design by city
Local SEO and web design, won one city at a time.
A plumber in Phoenix and a plumber in Toronto are in different businesses. Different houses, different customers, different searches. We studied eighteen cities with census and search data, and we build every website and every SEO plan around the market it has to win.
- Eighteen cities, each with its own SEO and web design page
- Figures from the U.S. Census Bureau and Statistics Canada
- Search demand for six trades, and for SEO help, in every city
Why SEO goes city by city
Google doesn't rank the best business in the country. It ranks the best one nearby.
Search "dentist near me" in Charlotte and in Las Vegas and you get two different pages. Google decides by distance, by reviews and by how well a business matches that place. So does ChatGPT when someone asks it who to call.
That means there is no national trick. You win Tampa by being the clearest, best-reviewed, most relevant answer in Tampa. Your website has to name the neighborhoods, the housing, the weather and the jobs that come with them.
It also means the opening is different in every city. Some are full of renters. Some are full of new arrivals. Some search for pest control three times as often as others. The tables below show where.
How local SEO worksWhat decides a local ranking
- How close you are to the person searching
- Your Google reviews: how many, how good, how recent
- A website that covers the service and the place
- Business details that match everywhere online
- Links and mentions from other local sites
SEO and web design demand
How many owners search for SEO and web design in each city.
Monthly Google searches for "[city] seo" and "[city] web design". These come from business owners looking for help. Toronto's figures are for Google in Canada, the rest for the United States.
| City | "[city] seo" | "[city] web design" |
|---|---|---|
| Austin, TX | 3,500 | 800 |
| Dallas, TX | 2,200 | 1,400 |
| Denver, CO | 2,000 | 2,500 |
| Orlando, FL | 1,300 | 700 |
| Toronto, ON | 1,300 | 800 |
| Las Vegas, NV | 1,200 | 450 |
| Phoenix, AZ | 1,100 | 500 |
| Houston, TX | 1,000 | 1,400 |
| Atlanta, GA | 800 | 1,200 |
| Tampa, FL | 600 | 600 |
| Nashville, TN | 400 | 500 |
| Charlotte, NC | 350 | 500 |
Austin owners search for SEO more than owners in any other city here. Denver leads on web design. In Denver, Houston, Atlanta, Charlotte and Nashville, web design is searched more than SEO. Wherever you are, your competitors are in these numbers, shopping for the same first page.
Source: Ahrefs Keywords Explorer, United States and Canada, November 2026.
Canadian cities: SEO and web design demand
Six more Canadian cities, and how their owners search for help.
Monthly searches on Google in Canada. Canadians type the city first or last, so both word orders are shown.
| City | "[city] seo" | "seo [city]" | "[city] web design" | "web design [city]" |
|---|---|---|---|---|
| Calgary, AB | 1,800 | 1,500 | 800 | 700 |
| Edmonton, AB | 1,400 | 1,700 | 1,100 | 800 |
| Vancouver, BC | 1,100 | 1,400 | 600 | 900 |
| Ottawa, ON | 700 | 600 | 700 | 300 |
| Winnipeg, MB | 700 | 450 | 200 | 200 |
| Mississauga, ON | 400 | 1,000 | 150 | 350 |
Calgary owners search "Calgary SEO" 1,800 times a month, more than any Canadian city here, Toronto included. Edmonton leads on web design. In Mississauga the order flips: "SEO Mississauga" gets 1,000 searches against 400 for "Mississauga SEO". Your city's page shows how hard each term is to win.
Source: Ahrefs Keywords Explorer, Canada, November 2026.
Twelve cities, side by side
People, households and who owns the home.
City-limit figures, not metro areas. U.S. population is the July 1, 2025 estimate, with growth measured from the April 2020 census base. Toronto is the 2021 Census, with growth from 2016.
| City | Population | Growth | Households | Owner-occupied |
|---|---|---|---|---|
| Toronto, ON | 2,794,356 | +2.3% | 1,160,890 | 52% |
| Houston, TX | 2,397,315 | +4.2% | 930,404 | 42.1% |
| Phoenix, AZ | 1,665,481 | +3.6% | 610,442 | 57.3% |
| Dallas, TX | 1,329,491 | +1.9% | 533,915 | 42.4% |
| Austin, TX | 1,002,632 | +4.6% | 456,113 | 43.4% |
| Charlotte, NC | 964,784 | +10.3% | 368,788 | 51.0% |
| Denver, CO | 740,613 | +3.5% | 335,428 | 48.8% |
| Nashville, TN | 721,074 | +4.6% | 313,513 | 52.4% |
| Las Vegas, NV | 679,817 | +5.3% | 247,741 | 56.6% |
| Atlanta, GA | 529,110 | +6.1% | 236,468 | 46.4% |
| Tampa, FL | 413,554 | +7.3% | 166,278 | 50.3% |
| Orlando, FL | 333,888 | +8.4% | 131,179 | 39.5% |
Charlotte is growing more than five times as fast as Dallas. Orlando has the lowest share of owner-occupied homes and Phoenix the highest. Each of those facts changes who your customer is and what your website should say.
Sources: U.S. Census Bureau QuickFacts (population estimates, July 1, 2025; households and owner-occupied rate, American Community Survey 2020 to 2024). Toronto: Statistics Canada, 2021 Census of Population, via City of Toronto census backgrounders.
Six more Canadian cities
The same measures north of the border.
City-limit figures from the 2021 Census, the same census as the Toronto row above. Growth is from 2016. Households are private dwellings occupied by usual residents.
| City | Population | Growth | Households | Owner-occupied |
|---|---|---|---|---|
| Calgary, AB | 1,306,784 | +5.5% | 502,301 | 68.8% |
| Ottawa, ON | 1,017,449 | +8.9% | 407,252 | 63.9% |
| Edmonton, AB | 1,010,899 | +8.3% | 396,404 | 63.6% |
| Winnipeg, MB | 749,607 | +6.3% | 300,431 | 63.1% |
| Mississauga, ON | 717,961 | -0.5% | 244,575 | 70.4% |
| Vancouver, BC | 662,248 | +4.9% | 305,336 | 45.5% |
Mississauga is the only city of the eighteen that lost people over its growth period, and it has the highest share of owners. Vancouver is the only one of these six where renters outnumber owners. The cities have kept growing since: Statistics Canada's July 1, 2025 estimates put Calgary at 1,612,834, Edmonton at 1,238,295 and Ottawa at 1,188,114.
Source: Statistics Canada, 2021 Census of Population, Census Profile; population estimates, July 1, 2025 (table 17-10-0155-01).
Owners and renters
Share of homes lived in by the people who own them.
Owners buy roofs, remodels and system replacements. Renters call for repairs and cleaning, and their landlords and property managers buy the rest.
- Phoenix57.3%
- Las Vegas56.6%
- Nashville52.4%
- Toronto52%
- Charlotte51.0%
- Tampa50.3%
- Denver48.8%
- Atlanta46.4%
- Austin43.4%
- Dallas42.4%
- Houston42.1%
- Orlando39.5%
In six of the twelve cities, at least half of households rent. A site in Houston, Dallas, Austin or Orlando needs pages for landlords and property managers. In Phoenix and Las Vegas, the homeowner pages do the heavy lifting.
Sources: U.S. Census Bureau QuickFacts, American Community Survey 2020 to 2024; Toronto from the 2021 Census via the City of Toronto housing backgrounder.
Homes and incomes
What the home is worth and what the household earns.
The eleven U.S. cities, 2020 to 2024, in 2024 dollars. Toronto reports in Canadian dollars on a different census, so its figures are on the Toronto page.
| City | Median home value | Median household income | Median rent |
|---|---|---|---|
| Denver, CO | $616,000 | $94,718 | $1,831 |
| Austin, TX | $555,300 | $93,658 | $1,729 |
| Atlanta, GA | $439,600 | $85,652 | $1,711 |
| Las Vegas, NV | $427,900 | $73,877 | $1,563 |
| Phoenix, AZ | $420,700 | $81,332 | $1,582 |
| Tampa, FL | $420,400 | $75,475 | $1,701 |
| Nashville, TN | $413,600 | $77,371 | $1,586 |
| Orlando, FL | $394,100 | $72,336 | $1,747 |
| Charlotte, NC | $385,700 | $82,068 | $1,612 |
| Dallas, TX | $320,700 | $70,518 | $1,472 |
| Houston, TX | $277,800 | $64,813 | $1,361 |
The median Denver home is worth more than twice the median Houston home. Higher values mean bigger tickets and owners who research longer before they call. Lower values mean price shoppers, where being first in the map results matters most.
Source: U.S. Census Bureau QuickFacts, American Community Survey 2020 to 2024 (owner-occupied home value, household income in 2024 dollars, gross rent).
Canadian homes and incomes
From Winnipeg to Vancouver, the home is worth four times as much.
The six Canadian cities, in Canadian dollars. Dwelling values are as reported by owners in the 2021 Census. Household income is total income for 2020, before tax.
Vancouver, BC
- Median dwelling value
- $1,450,000
- Median household income
- $82,000
Mississauga, ON
- Median dwelling value
- $900,000
- Median household income
- $102,000
Ottawa, ON
- Median dwelling value
- $624,000
- Median household income
- $102,000
Calgary, AB
- Median dwelling value
- $456,000
- Median household income
- $98,000
Edmonton, AB
- Median dwelling value
- $384,000
- Median household income
- $90,000
Winnipeg, MB
- Median dwelling value
- $340,000
- Median household income
- $80,000
| City | Median dwelling value | Median household income |
|---|---|---|
| Vancouver, BC | $1,450,000 | $82,000 |
| Mississauga, ON | $900,000 | $102,000 |
| Ottawa, ON | $624,000 | $102,000 |
| Calgary, AB | $456,000 | $98,000 |
| Edmonton, AB | $384,000 | $90,000 |
| Winnipeg, MB | $340,000 | $80,000 |
Vancouver has the highest home values of the six and nearly the lowest household income. Ottawa and Mississauga earn the most. Winnipeg and Edmonton are the affordable ones, with careful buyers who compare before they call.
Source: Statistics Canada, 2021 Census of Population, Census Profile (median value of dwellings; median total income of household in 2020). Canadian dollars.
Growth means strangers
Charlotte, Orlando, Tampa and Atlanta have each grown more than 6% since 2020. New residents have no referrals. They search, and they pick from the first page.
+10.3% in Charlotte
The city line is not your market
These are city-limit figures. The real market runs past the city line into suburbs that search with their own town names. A site needs a page for each.
City limits only
Language is an opening
In Houston, 47.1% of residents age five and up speak a language other than English at home. In Dallas it is 41.2% and in Orlando 40.8%. A well-written Spanish page reaches households most competitors skip.
47.1% in Houston
Demand is different in every city
"Pest control phoenix" gets 2,900 searches a month. "Pest control charlotte" gets 800. The same trade is a different size in a different place, and your pages should chase what your city searches.
2,900 vs 800
Density changes the job
Toronto fits 1,160,890 households into its city limits, and 46.7% of them live in buildings of five storeys or more. Work in a tower is sold and searched differently from work in a subdivision.
46.7% high-rise in Toronto
Ownership swings just as far in Canada
In Mississauga 70.4% of households own their home and in Calgary 68.8%. In Vancouver 45.5% do. The first two are homeowner markets for roofs, furnaces and renovations. Vancouver needs pages for tenants, stratas and property managers.
70.4% vs 45.5%
One search, twelve cities
Monthly searches for "plumber" plus the city name.
The same search, typed with twelve different city names. Toronto's figure is for Google in Canada, the rest for the United States.
- plumber phoenix1,900
- plumber houston1,500
- plumber toronto1,500
- plumber las vegas1,300
- plumber atlanta1,300
- plumber dallas1,100
- plumber austin1,000
- plumber denver900
- plumber charlotte700
- plumber tampa600
- plumber orlando600
- plumber nashville450
These count only searches that name the city. Most people type "plumber near me", which gets 536,000 searches a month across the United States, and Google uses their location. Real local demand in every one of these cities is larger than its bar.
Source: Ahrefs Keywords Explorer, United States and Canada, November 2026.
Search demand by city
What each city types into Google, trade by trade.
Monthly searches for the trade plus the city name.
| City | HVAC | Electrician | Dentist | Pest control |
|---|---|---|---|---|
| Dallas, TX | 1,000 | 350 | 1,500 | 1,700 |
| Houston, TX | 1,000 | 700 | 1,300 | 2,300 |
| Austin, TX | 800 | 500 | 900 | 1,300 |
| Phoenix, AZ | 1,700 | 1,100 | 1,500 | 2,900 |
| Las Vegas, NV | 1,100 | 600 | 2,900 | 1,000 |
| Denver, CO | 1,000 | 600 | 1,200 | 1,000 |
| Tampa, FL | 700 | 600 | 600 | 1,300 |
| Orlando, FL | 600 | 400 | 1,400 | 2,100 |
| Atlanta, GA | 1,000 | 500 | 1,500 | 1,700 |
| Charlotte, NC | 250 | 350 | 800 | 800 |
| Nashville, TN | 400 | 700 | 1,000 | 1,400 |
| Toronto, ON | 1,400 | 800 | 1,000 | 1,500 |
Phoenix leads on HVAC, electricians and pest control. Las Vegas searches for a dentist almost twice as often as any other city here. Your city's page breaks down what that means for your trade.
Source: Ahrefs Keywords Explorer, November 2026. United States figures for U.S. cities, Canada for Toronto. Searches that name the city only.
Search demand in Canadian cities
What the six Canadian cities type, trade by trade.
Monthly searches on Google in Canada for the trade plus the city name.
| City | Plumber | HVAC | Dentist | Pest control |
|---|---|---|---|---|
| Vancouver, BC | 1,300 | 500 | 1,100 | 1,100 |
| Calgary, AB | 1,500 | 900 | 800 | 1,500 |
| Edmonton, AB | 1,100 | 800 | 1,300 | 1,700 |
| Ottawa, ON | 1,300 | 1,100 | 450 | 400 |
| Mississauga, ON | 1,200 | 600 | 1,000 | 1,000 |
| Winnipeg, MB | 900 | 700 | 900 | 700 |
Calgary searches for plumbers by name as often as Toronto and Houston do. Edmonton leads the six on dentists and pest control, and Ottawa on HVAC. These count only searches that name the city.
Source: Ahrefs Keywords Explorer, Canada, November 2026. Searches that name the city only.
SEO and web design, city by city
Eighteen markets. Eighteen different playbooks.
Each page covers SEO, web design and AI search for that city, with the local numbers behind it.
-
Dallas, TX
1.3 million people, and pest control is the most-searched trade we track here.
Dallas SEO and web design -
Houston, TX
The largest U.S. city on our list. Nearly half of residents speak another language at home.
Houston SEO and web design -
Austin, TX
Past one million residents, with fewer than half of homes owner-occupied.
Austin SEO and web design -
Phoenix, AZ
The highest home ownership of the U.S. cities and the most searches for plumbers, HVAC and pest control.
Phoenix SEO and web design -
Las Vegas, NV
A valley of newcomers. Barely a quarter of residents were born in the state, so they search for everything.
Las Vegas SEO and web design -
Denver, CO
2,500 searches a month for "Denver web design", the most of the eighteen, and suburbs growing faster than the city.
Denver SEO and web design -
Tampa, FL
Up 7.3% since 2020, split evenly between owners and renters.
Tampa SEO and web design -
Orlando, FL
The most renters of the eighteen, and 2,100 searches a month for pest control by name.
Orlando SEO and web design -
Atlanta, GA
A city of 529,110, up 6.1% since 2020, with 1,700 searches a month for pest control by name.
Atlanta SEO and web design -
Charlotte, NC
The fastest-growing city here: up 10.3% in five years and closing in on a million people.
Charlotte SEO and web design -
Nashville, TN
A boom town where the counties around the city grow even faster than it does.
Nashville SEO and web design -
Toronto, ON
Canada's largest city: nearly half high-rise, three in ten homes a condo, dozens of languages.
Toronto SEO and web design
Canadian cities
Six more cities, from the Pacific to the Ottawa River.
Built on Statistics Canada figures, with Canadian spelling, metric units and search demand from Google in Canada.
-
Vancouver, BC
The only one of these six where renters outnumber owners: 54.5% of households rent.
Vancouver SEO and web design -
Calgary, AB
1.3 million people at the 2021 Census and the most searches for "[city] SEO" of our Canadian cities.
Calgary SEO and web design -
Edmonton, AB
Past one million people, with the most searches by name for dentists and pest control of the six.
Edmonton SEO and web design -
Ottawa, ON
A bilingual capital where Kanata, Orléans and Barrhaven each search under their own name.
Ottawa SEO and web design -
Mississauga, ON
Seven in ten households own, and every "near me" search competes with Toronto and Brampton.
Mississauga SEO and web design -
Winnipeg, MB
Six in ten homes built before 1981, 52 nights a year below -20°C and SEO terms that score zero for difficulty.
Winnipeg SEO and web design
Same plan in every city
Wherever you work, this is what you get.
AI Local Growth is $99/month and the website is built free. Month-to-month. No contract. No setup fee.
$99/monthMonth-to-month. No contract. No setup fee.
See pricing- A fully custom website, designed, written and launched for you. Unlimited pages.
- Unlimited edits. Text us a change and it's done.
- Local SEO: on-page, off-page, backlinks and local citations
- Google Business Profile management and a Google review system
- AI search optimization for ChatGPT, Claude, Perplexity and Google's AI Overviews
- A new blog post every month
- Fast hosting, security, backups and maintenance
- Monthly reports: rankings, Google Search Console and AI visibility
Results
Local search, won for real businesses.
Rankings and customer actions for businesses we work with.
2,600 rankingsin Google's top 20, up from about 600 when they hired us
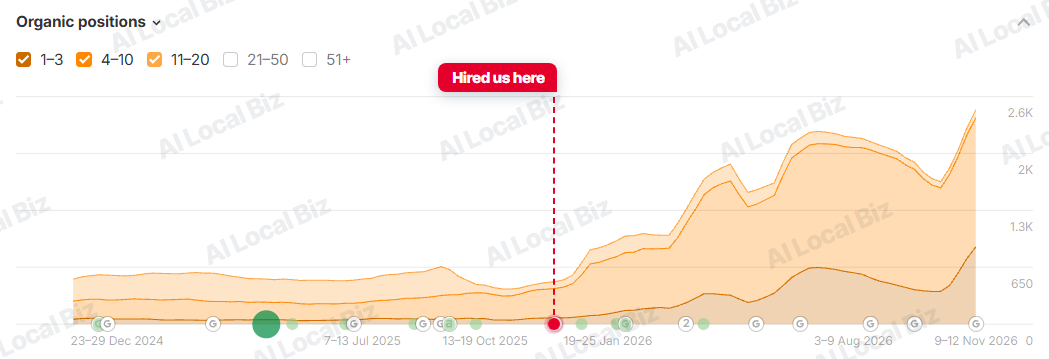
Keywords in positions 1 to 20. Ahrefs estimate for a client's website, two years to November 2026. 184 callsplus 190 direction requests and 108 website visits
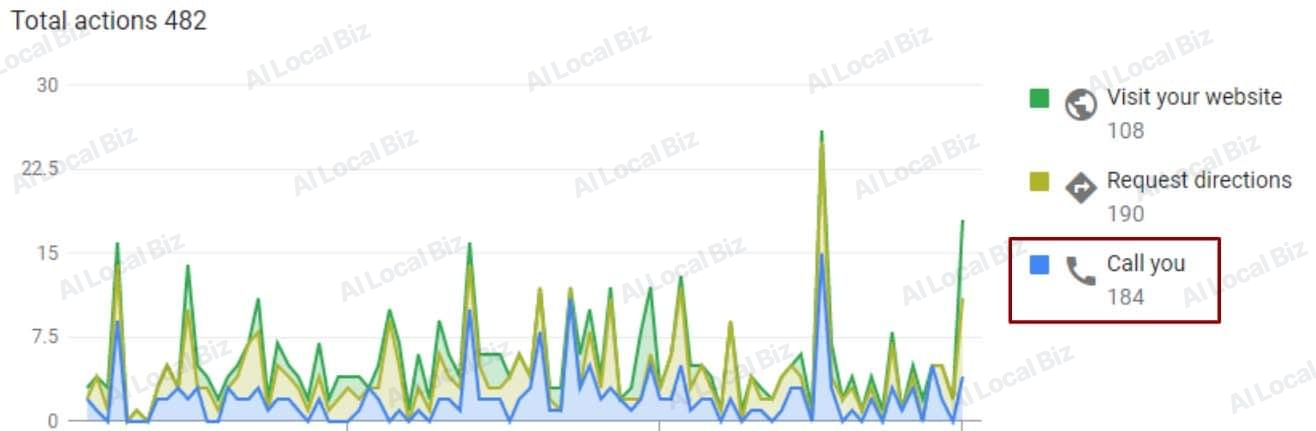
482 customer actions. Google Business Profile, a business we manage.
Real screenshots from Google Business Profile and Ahrefs for businesses we work with, shown as the tools report them. We added our name as a watermark and marked where each business hired us. Business names are kept private.
About locations
Questions about where we work.
Do you have an office in each of these cities?
No. We work with local businesses in all eighteen, and we do not have an office in any of them. What we bring is the research on each city page, a website written for your market and SEO work every month.
My city isn't on this list. Can I still sign up?
These eighteen are the cities we cover with full market research today. If you are nearby or somewhere else, get in touch and we will tell you straight whether we can help. Contact us
I'm in a suburb, not the city itself. Which page applies to me?
Read the page for your nearest city, then tell us your town. Your website gets built around where you are and the towns you serve, because that is how Google ranks you. The city pages name many of the suburbs and how they differ. Local landing pages
Why are these city figures and not metro figures?
Because Census city figures are the most consistent way to compare eighteen places. The real market is always bigger than the city line, and each city page covers the surrounding suburbs or counties.
Is the plan different from city to city?
No. Same plan, same price: $99/month, with the website built free. What changes is the research behind it and the pages we write. A Tampa site and an Orlando site should not read alike, and ours don't.
Do you only work with the trades shown in the tables?
No. The tables show six trades because that is the search data we pulled for every city. We build for roofers, landscapers, painters, contractors, cleaning companies, auto repair shops, salons and more. See all industries
Sources for the comparison
- U.S. Census Bureau. QuickFacts: Dallas, Houston, Austin and Phoenix (Population estimates July 1, 2025; ACS 2020 to 2024)
- U.S. Census Bureau. QuickFacts: Tampa, Orlando, Atlanta and Charlotte (Population estimates July 1, 2025; ACS 2020 to 2024)
- U.S. Census Bureau. QuickFacts: Denver, Nashville-Davidson and Las Vegas (Population estimates July 1, 2025; ACS 2020 to 2024)
- City of Toronto, from Statistics Canada 2021 Census data. 2021 Census backgrounder: population and dwelling counts, Toronto (2021 Census)
- City of Toronto, from Statistics Canada 2021 Census data. 2021 Census backgrounder: housing (tenure), Toronto (2021 Census)
- City of Toronto, from Statistics Canada 2021 Census data. 2021 Census backgrounder: type of dwelling, Toronto (2021 Census)
- Statistics Canada. Census Profile, 2021 Census of Population: Vancouver, Calgary, Edmonton, Ottawa, Mississauga and Winnipeg (population, dwellings, tenure, dwelling value, household income) (2021 Census; incomes are for 2020)
- Statistics Canada. Table 17-10-0155-01: Population estimates, July 1, by census subdivision, 2021 boundaries (July 1, 2025)
- Ahrefs. Keywords Explorer: monthly search volume (United States and Canada, November 2026)
U.S. and Canadian figures come from different censuses and years, as labelled. "Nashville" is the Nashville-Davidson metropolitan government (balance). Census survey figures are estimates with margins of error. Canadian dollar figures are not converted.
Your city has its own numbers. Let's win it.
We build your website free, around your market. Then we rank it on Google and get you recommended by AI.
Only 14 free builds left this month.
$0 today. No contract. Love it or pay nothing.